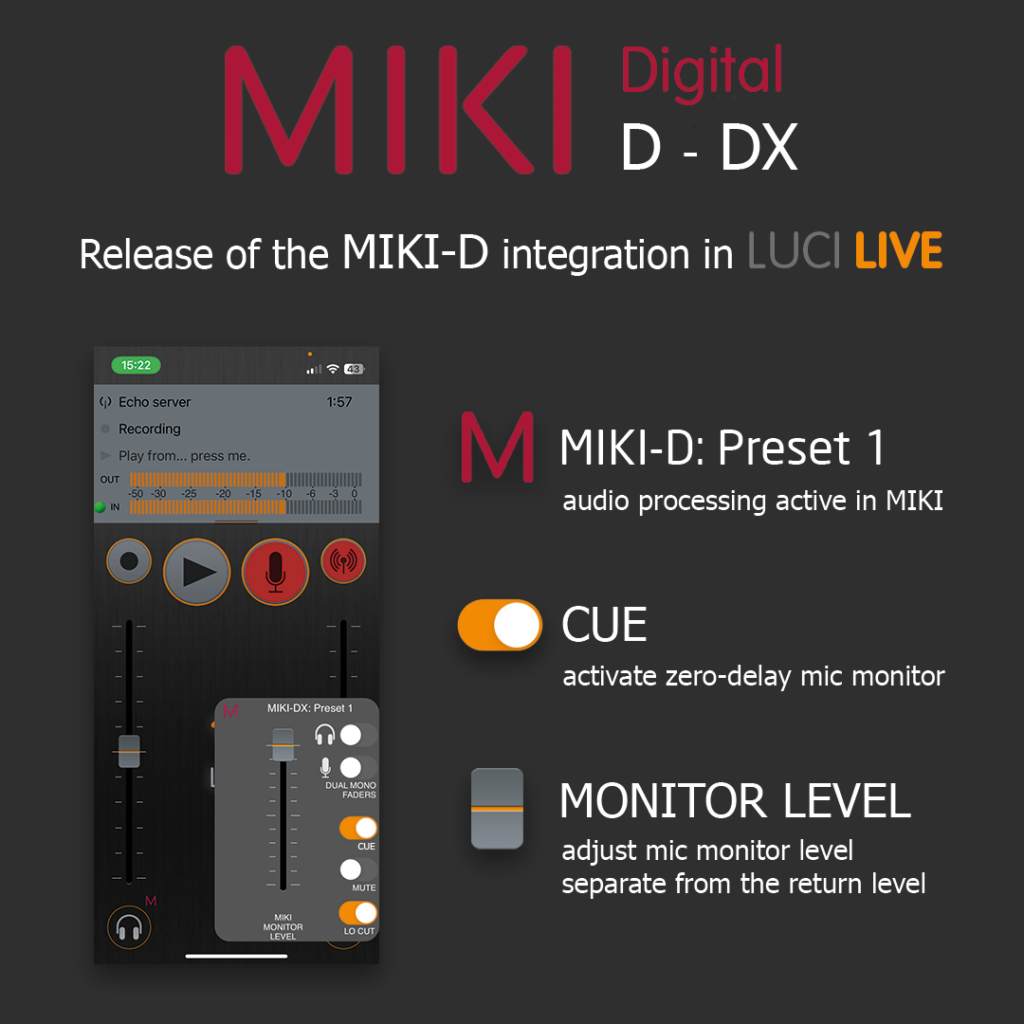
LUCI Knowledge Base

Quality Eye, a new feature in the latest release of LUCI STUDIO

The Eye shows the connection quality based on combined measurements of lost packets, sequence errors, buffer underruns, and peak jitter. Use the tool to determine whether a connection is good enough to go live. The rate is colored from green (all good), yellow (no audible artifacts), to red (not good).

The Eye’s total display time ranges from 1 minute to 12 hours. Combined with the LUCI STUDIO Log Analyzer, this is a great add-on for monitoring your connections over time.

release qualityeye connectionquality lucistudio TechnicaDelArte

More information here

LUCI Studio & LUCI Live now support NDI®

NDI® (Network Device Interface) by NewTek™ is a high performance standard that allows anyone to use real time, ultra low latency video on existing IP video networks. The local NDI® streams can be used in the video function of LUCI Live and LUCI Studio for its video streaming features via the public internet, making it possible to incorporate your LUCI setup on the IP video network.

More information about LUCI and NDI® here.

LUCI Studio with OSC (Open Sound Control)

Control your LUCI Studio with any OSC compatible software or hardware device within the local network.

Open Sound Control (OSC) is a protocol for networking sound synthesizers, computers, and other multimedia devices for purposes such as musical performance or show control. OSC’s advantages include interoperability, accuracy, flexibility and enhanced organization and documentation.

Read more here !


A wizard in LUCI STUDIO release 5.8.3

LUCI STUDIO has some interesting new features that should make life easier:

Connection Wizard & Connection Event Graphs
  • We added a Wizard to help you setup a new Station that will use the RTP protocol for Audio over IP connections.
  • Support for UPNP to help you with the “difficult” task of port forwarding and to check if that communications port is reachable from the public internet.
  • And to be able to determine the cause and frequency of particular connection faults like dropped packets, or jitter buffer overruns, we have added a history event graph called Connection Event Graph ( CEG ) . Every connection parameter in the Info screen can now display a graph over time. It also lets you Log these values to a comma separated file (.csv) with timestamp for later analysis.
About
Careers
Newsroom
History
Contact
Open Support Ticket
Terms & Conditions
Privacy Policy
Disclaimer


© Technica Del Arte 2025