You can set Logging mode in Options -> General. Set Logging to CALLS/EVENTS/DETAILED, will create Log files in the directory Documents\LuciStudio-Logs\. Additionally, you can choose to record the Connection Event Graphs (CEG) in the Info window. These will then be saved alongside in the CEG directory. Luci Studio stores its Log files as CSV (Comma Separated Values) which you can open with any installed spreadsheet program.
For Analyze these logs files the Log Analyzer opens and shows all combined log data of a selected day.
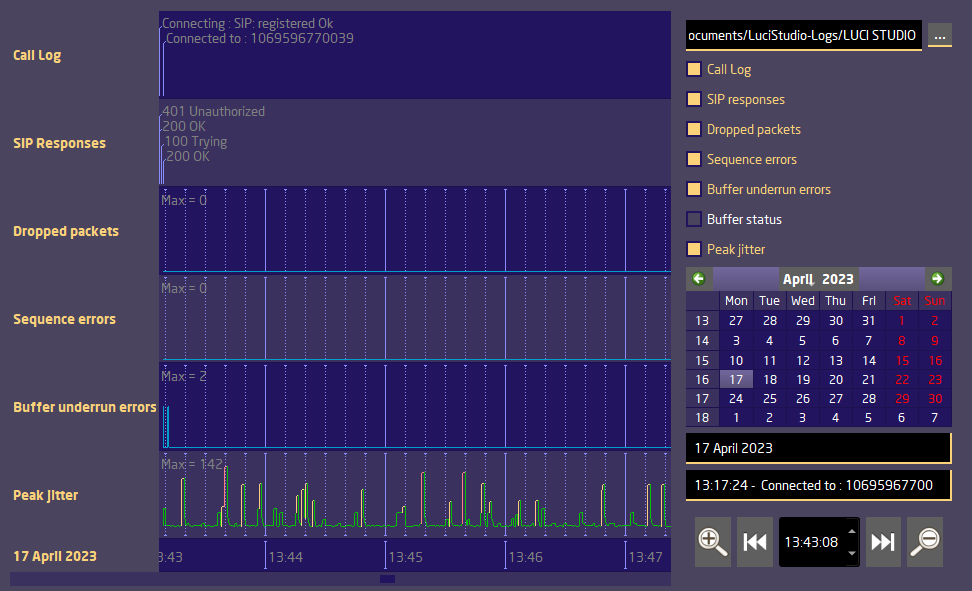 The Analyzer shows the CEG graphs together with the Call Log events. The SIP response codes can be shown separate as an alternative connection event. The graphs are shown just as in the Info window, automatically scaled to its maximum value, which is the most top position of that graph. There are numerous selectors for going through the Logs:
![]()
Luci Studio Instance selector. Every Instance stores the logs in an own Directory. This selector allows you to open any Log Directory.
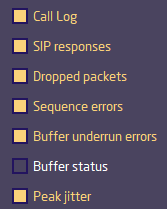
Graph selector. As CEG are not always recorded, you can switch the CEG of interest on or off. SIP responses are only logged on SIP calls.
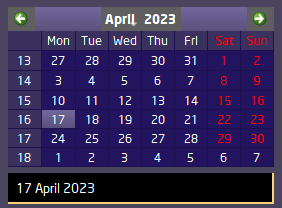
Day Selectors. There is a calendar selector or a list of all logged days, either selection will open the logs for that day, showing the 1e connection log of that day.
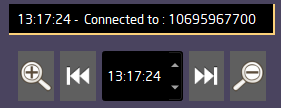
Connection Selector. The list has only the recorded connections, on selection it will scroll to beginning of the event. You can change the view time with the scrollbar under the graphs or the time selector. The jump back and jump forward buttons jump to the previous or next connection. The zoom in and out buttons handle the Graphs time resolution.